Strating the Local Leaderboard
Local Leaderboard
Local Leaderboard
Start the local leaderboard server from the command line:Expected output:Once the server is running, open your browser and navigate to the local URL or using public URL.
You can share the public URL to allow others to access it remotely.
Filtering and Searching
The leaderboard provides powerful filtering capabilities to help you focus on relevant benchmark results.Filter Panel
Filter Panel
The filter panel on the left side of the leaderboard allows you to narrow down results by:
- Model: Select specific models (NousResearch/Meta-Llama-3.1-8B, NousResearch/Llama-3.2-1B, etc.)
- Engine: Filter by inference engine (vLLM, SGLang, etc.)
- Benchmark Type: Choose specific benchmark workloads (conversational_short, summarization, etc.)
- Hardware: Filter by hardware configuration (NVIDIA H100 80GB HBM3, NVIDIA H100 80GB HBM3 (4x), etc.)
-
Precision: Select specific Precision of Engine (FP16, FP8, BF16, etc.), this filter only works when you select
Show all precision -
Advanced Filters: Filter results by Engine Args, Env Vars, Benchmark Config and Subrun ID, these filters only works when you select
Show details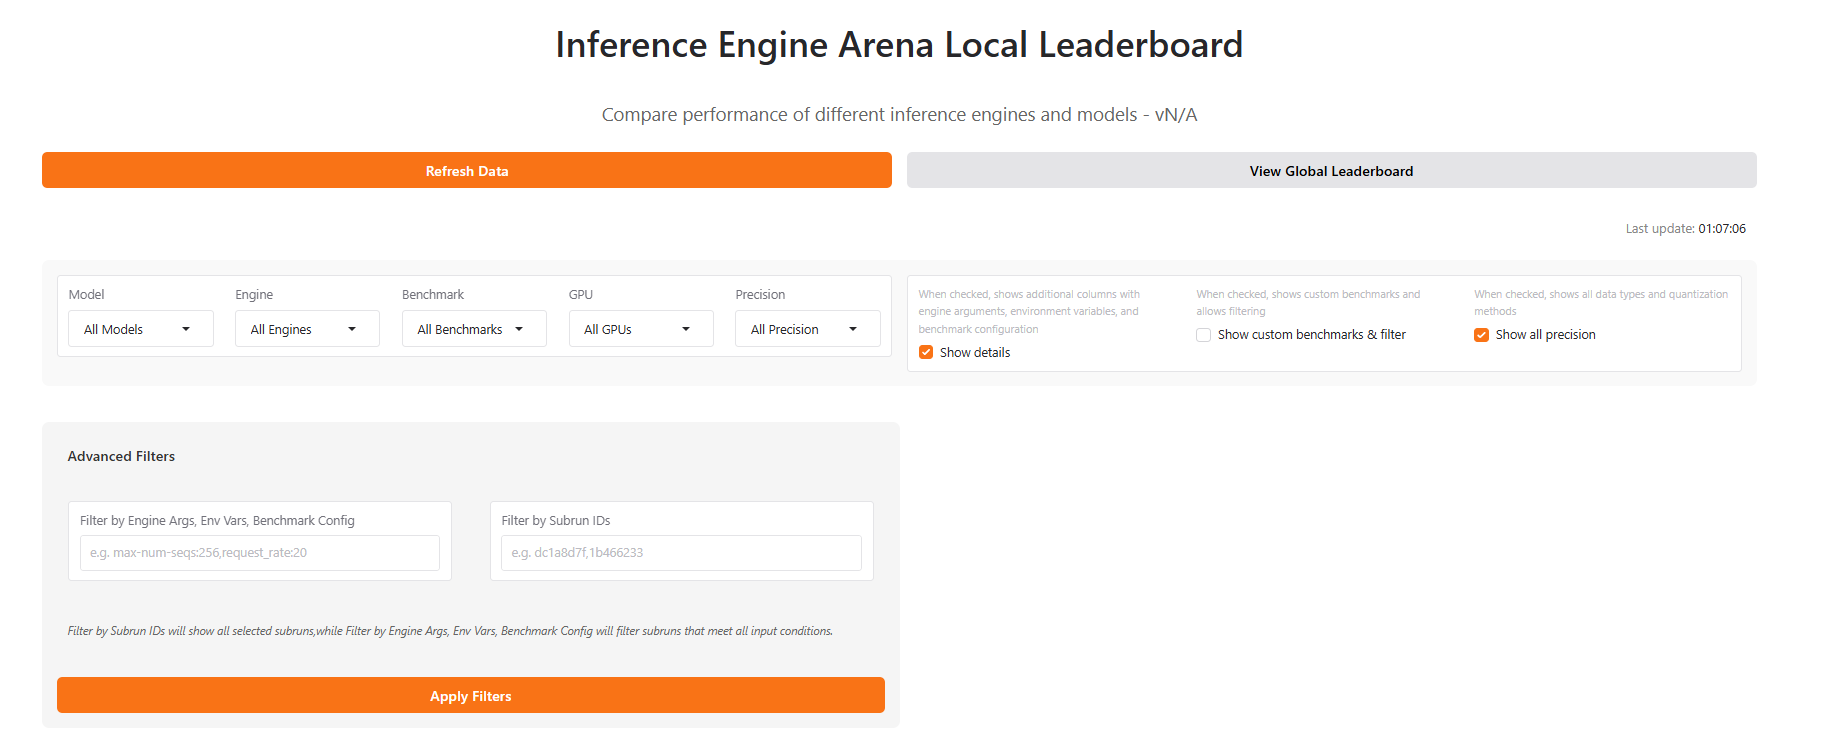
- Show details: When checked, shows additional columns with engine arguments, environment variables, and benchmark configuration, and will allow you to use
Advanced filters - Show custom benchmarks & filter: When checked, shows custom benchmarks and allows filtering
- Show all precision: When checked, shows additional columns of quantization methods, and allows filtering by precision
Filtered Results
The main leaderboard view displays results in a comprehensive table format. You can also click the button ofShow details to see some detailed information of the selected sub-run.
Table View
Table View
The results table shows key metrics for each benchmark run: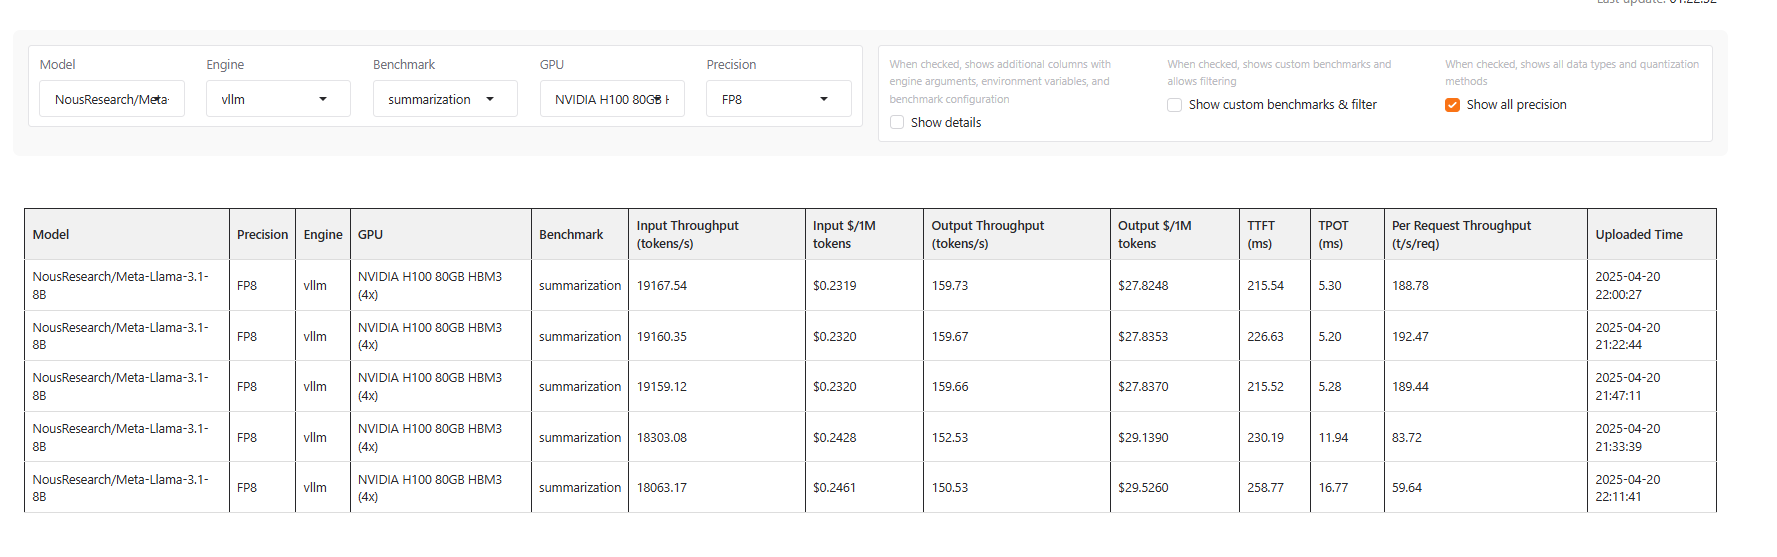
- Model: Model name
- GPU: Hardware information
- Precision: Precision of Engine, if you select
Show all precision - Engine: Inference engine type and version
- Benchmark: Benchmark type
- Input Throughput: Tokens per second for input processing and price
- Output Throughput: Tokens per second for generation and price
- Input $/1M tokens: Price for input tokens
- Output $/1M tokens: Price for output tokens
- TPOT: Time Per Output Token in milliseconds
- TTFT: Time to First Token in milliseconds
- Per Request Throughput: Throughput per second per request
- Uploaded Time: When the benchmark was uploaded to the leaderboard
Show details, you can see the more information of these sub-runs as follows:- Subrun ID: Subrun ID of the benchmark result
- Engine Args: Engine Args when starting the engine
- Env Vars: Env Vars when starting the engine
- Benchmark Config: Benchmark Config like
random-input-len,random-output-len, etc - Reproducible Commands: The command to reproduce the benchmark result
Scatter Plot Visualization
The scatter plot view provides a powerful way to visualize relationships between different arguments, and it is synchronized in real time with the filter results above.Scatter Plot
Scatter Plot
The scatter plot view provides an interactive visualization of benchmark results, accessible below the table view: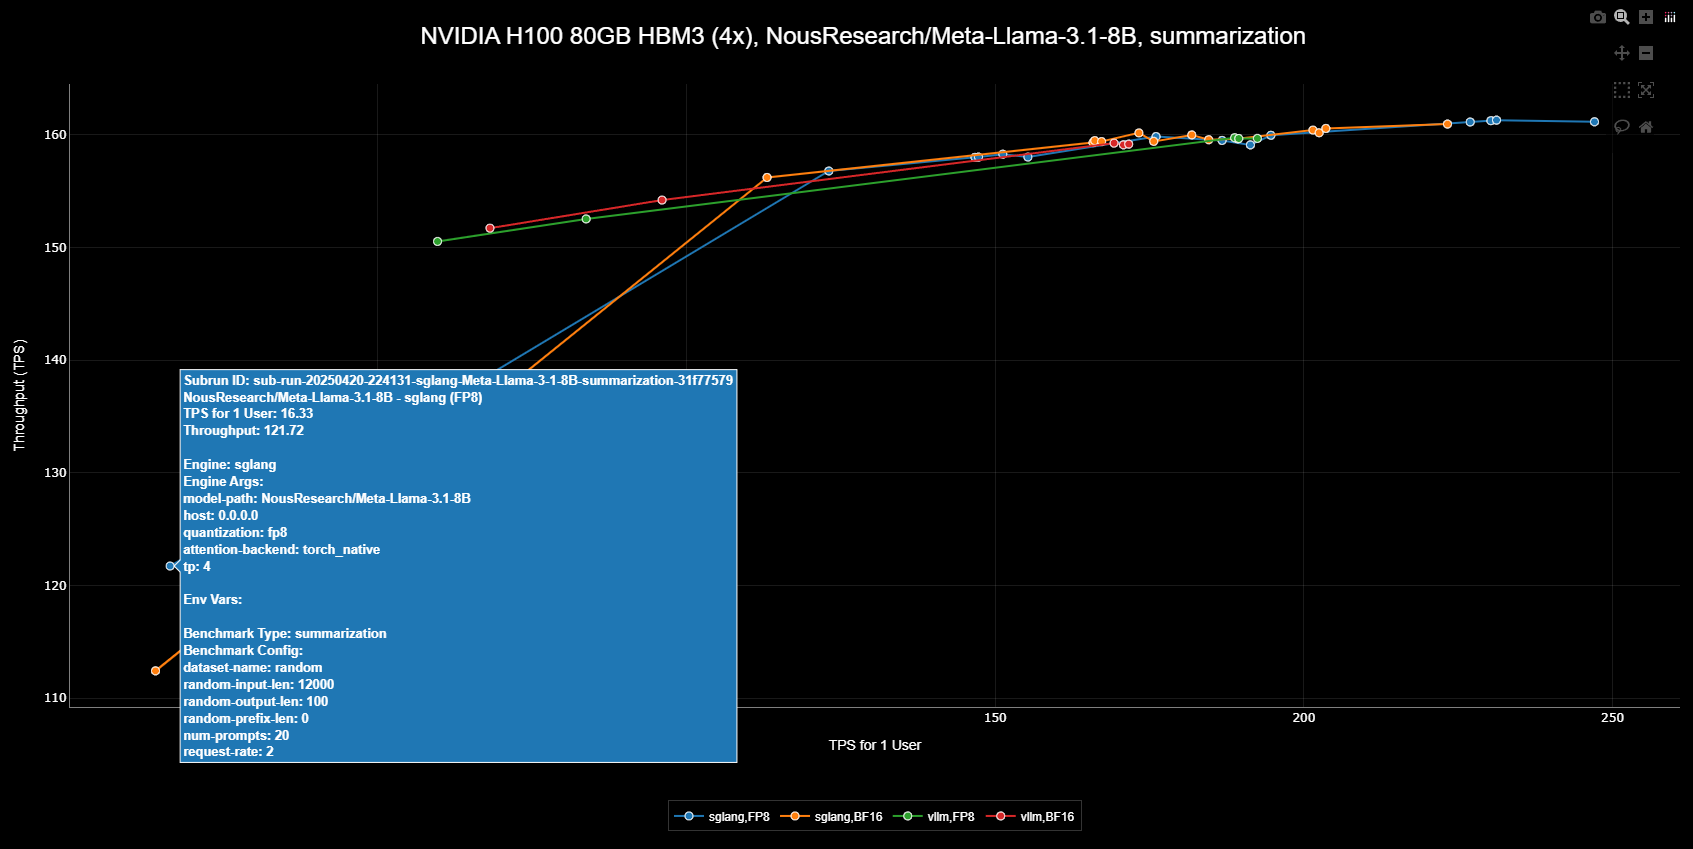
- Title: Shows the common attributes across all data points (Engine, GPU, Precision, Benchmark, Model)
- Legend: Highlights the differentiating factors between data points
- Blue points: Results of SGLang Engine using FP8 quantization
- Orange points: Results of SGLang Engine without FP8 quantization
- Green points: Results of vLLM Engine using FP8 quantization
- Red points: Results of vLLM Engine without FP8 quantization
- Compare performance impact of FP8 quantization
- Compare performance impact of vLLM and SGLang
- Identify optimal parameter combinations for FP8-enabled runs
- Analyze trade-offs between different configurations
Global Leaderboard
The global leaderboard connects you with the broader inference engine community. Visit https://iearena.org/ to view and share your benchmark results with others.Community Results
Community Results
The global leaderboard aggregates benchmark results from users worldwide, and it also provides more filtering options than the local leaderboard: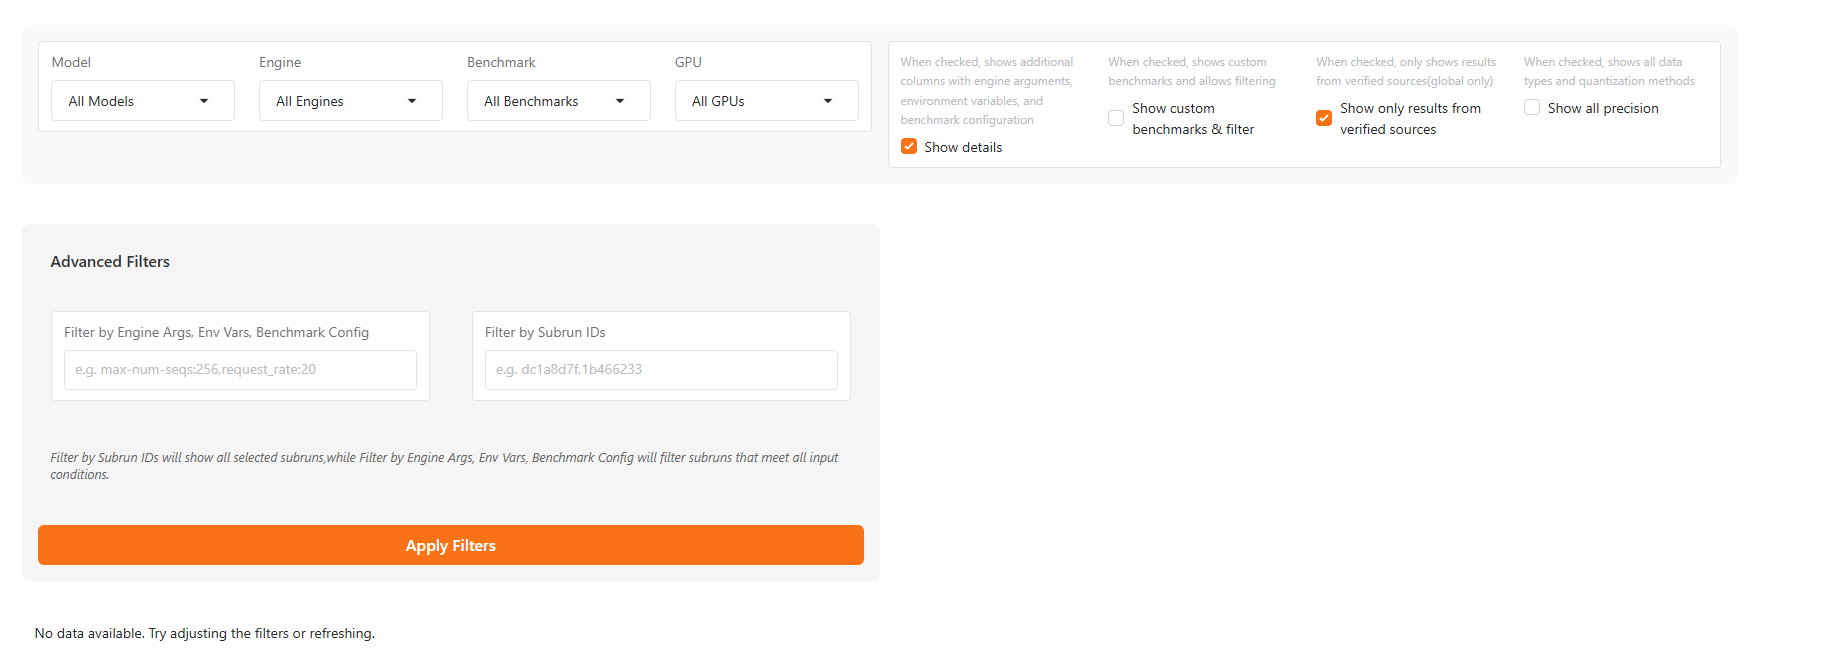
Show only results from verified sources:- Show only results from verified sources: When checked, anonymously uploaded data will not be displayed
- Discovering optimized configurations
- Reproducing others’ results using the Reproducible Commands and the corresponding environment.
- Comparing with others’ results helps to minimize the time required for adjusting your engine.
Metrics
Inference Engine Arena collects a comprehensive set of metrics to help you evaluate and compare the performance of different inference engines. This guide explains the key metrics and how to interpret them.Key Performance Metrics
Throughput
How fast can the engine process tokens?
Latency
How responsive is the engine to requests?
Memory Usage
How efficiently does the engine use GPU memory?
Concurrency
How well does the engine handle multiple simultaneous requests?
Throughput Metrics
Input Throughput
Input Throughput
Input Throughput measures how quickly the engine can process input tokens (the prompt text).
- Unit: Tokens per second (tokens/s)
- Higher is better
- Example: 10,000 tokens/s means the engine can process 10,000 prompt tokens per second
Output Throughput
Output Throughput
Output Throughput measures how quickly the engine can generate new tokens (the response text).
- Unit: Tokens per second (tokens/s)
- Higher is better
- Example: 100 tokens/s means the engine can generate 100 new tokens per second
Total Throughput
Total Throughput
Total Throughput measures the combined rate of processing input and generating output tokens.
- Unit: Tokens per second (tokens/s)
- Higher is better
Request Throughput
Request Throughput
Request Throughput measures how many complete requests the engine can handle per second.
- Unit: Requests per second (RPS)
- Higher is better
- Example: 5 RPS means the engine can complete 5 full inference requests per second
Latency Metrics
Time to First Token (TTFT)
Time to First Token (TTFT)
Time to First Token (TTFT) measures how long it takes from sending a request until receiving the first token of the response.
- Unit: Milliseconds (ms) or seconds (s)
- Lower is better
- Example: 500ms TTFT means users wait half a second before seeing any response
Time Per Output Token (TPOT)
Time Per Output Token (TPOT)
Time Per Output Token (TPOT) measures the average time it takes to generate each output token.
- Unit: Milliseconds per token (ms/token)
- Lower is better
- Example: 20ms/token means each token takes an average of 20ms to generate
End-to-End Latency
End-to-End Latency
End-to-End Latency measures the total time from sending a request until receiving the complete response.
- Unit: Milliseconds (ms) or seconds (s)
- Lower is better
Memory Metrics
Peak GPU Memory Usage
Peak GPU Memory Usage
Peak GPU Memory Usage measures the maximum amount of GPU memory used during inference.
- Unit: Megabytes (MB) or Gigabytes (GB)
- Lower is better for a given model
- Example: 15GB peak memory means you need at least that much VRAM on your GPU
Memory Efficiency
Memory Efficiency
Memory Efficiency is calculated as throughput per GB of memory used.
- Unit: Tokens per second per GB (tokens/s/GB)
- Higher is better
Concurrency Metrics
Scaling Efficiency
Scaling Efficiency
Scaling Efficiency measures how throughput increases as concurrency increases.
- Unit: Percentage (%)
- Higher is better
- Example: 90% scaling efficiency from 1 to 8 concurrent requests means throughput increases by 7.2x (rather than the ideal 8x)
Max Effective Concurrency
Max Effective Concurrency
Max Effective Concurrency is the concurrency level beyond which additional concurrent requests no longer improve throughput.
- Unit: Number of concurrent requests
- Higher is better
Interpreting Benchmark Results
When analyzing benchmark results, consider:- Workload Characteristics: Different engines excel at different types of workloads. Match the metrics that matter most to your specific use case.
- Hardware Utilization: Check how efficiently each engine utilizes your hardware. Some engines may perform better on specific GPU architectures.
- Trade-offs: There’s often a trade-off between throughput and latency. Decide which is more important for your application.
- Scaling: Look at how performance scales with concurrency to understand how the engine will behave under load.
Visualizing Metrics
Inference Engine Arena provides various ways to visualize metrics:- Comparative Bar Charts: Compare key metrics across different engines
- Time Series Graphs: See how metrics evolve during a benchmark run
- Scaling Curves: Understand how performance scales with concurrency